|
Laying out Tables
Different Tables
Table 1 gives figures about fires in the home. Fire brigades
were called to put them out. Many tables in statistics look like
this. Some people find them hard to read. In this unit you will
learn how to make tables and how to read and understand them. By
the end you should be able to make more sense of them.
| Cause |
Number
started in |
Total4
number of fires |
| Kitchen |
Bedroom1 |
Living Room |
Hall2 |
Roof Space |
Elsewhere3
or not known |
| Cooking |
17226 |
174 |
- |
- |
- |
- |
17000 |
| Space heating |
504 |
1400 |
2352 |
168 |
- |
1176 |
6000 |
| Smoking Materials |
342 |
1482 |
1216 |
76 |
- |
684 |
4000 |
| Children |
132 |
990 |
330 |
165 |
33 |
1650 |
3000 |
| Wiring Installations |
403 |
403 |
310 |
527 |
155 |
1302 |
3000 |
| Chimneys |
153 |
272 |
289 |
17 |
255 |
714 |
2000 |
| TV and radio |
17 |
51 |
1547 |
- |
- |
85 |
2000 |
| Other |
2840 |
3124 |
1704 |
710 |
426 |
5396 |
14000 |
| Total all causes |
21617 |
7896 |
7748 |
1663 |
869 |
11007 |
51000 |
| |
|
|
| |
1 |
Includes bed-sitting rooms |
| |
2 |
Includes stairs and corridors |
| |
3 |
Includes fires which started outside and
spread to the building |
| |
4 |
Totals have been rounded to the nearest
thousand. |
Table 1 - Domestic fires in the United Kingdom: by cause and
room of origin, 1976 - (Source: Social Trends, No. 8, 1977, page
197)
Not all tables are as difficult as Table 1.
What do you call the table you would use:
| a |
to find times of buses or
trains, |
| b |
to find out what nine sevens
are, |
| c |
to find out which lesson you
should be at? |
| d |
Write down one other table which
you use to get information. |
Building up a Table
You will need page R1.
Statistical tables contain lots of numbers. Sometimes we
measure (length, area, weight, etc.)
Sometimes we count (the number of people, the number of fires,
etc.)
In each case this numerical information is called DATA.
When we count, the numbers we get are called FREQUENCIES.
Data
Eleven children wrote down their favourite musical
instrument. Here is what they wrote.

| a |
How many different instruments
did they choose? |
| b |
Which instrument was most
popular? |
It is easier to answer these questions from a table.
| c |
Copy and complete Table 2. |
This tells us how many children chose each
instrument.
It is a FREQUENCY TABLE.
| Instrument |
Frequency |
| Bagpipe |
3 |
| |
|
| Total |
11 |
Table 2
We can also see what fraction of children chose each
instrument. 3 out of the 11 children chose 'bagpipe'.
This is a fraction 3/11.
| d |
What fraction of the children
chose the guitar? |
| e |
Write down your favourite kind
of sweets (e.g. toffee, chocolate)
Give your answer to your teacher. |
| f |
Complete Table 5 on page Rl to
show the favourite sweets of all the pupils in your
class. Put in the frequencies (how many times each type
of sweet was chosen). Don't forget to put the total at
the bottom. |

Tidiness
The word STATISTICS can also mean data. Sometimes statistics
are carelessly laid out. The meaning of the figures is not always
clear. We can tidy up as we put the figures into a table. A graph
or bar chart may make the picture clearer still.

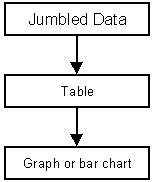
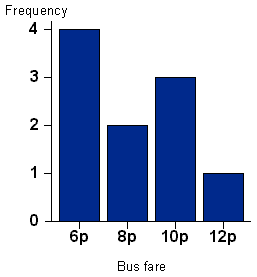
Figure 1 shows how to do this. It starts with a jumble of 10
pupils' bus fares. They are tidied into a table. In the bar chart
the frequencies stand out clearly.
| Jumbled data |
| 8p |
|
10p |
|
6p |
|
6p |
|
|
|
6p |
| |
6p |
|
|
|
|
|
|
10p |
|
|
| 10p |
|
8p |
|
12p |
|
|
|
|
|
|
| Bus fare |
Frequency |
| 6p |
4 |
| 8p |
2 |
| 10p |
3 |
| 12p |
1 |
Bar chart
 |
Figure 1 - Bus fares
| a |
Which fare came most often in
the data? |
| b |
Which fare came least often? |
The data are in three forms: jumbled, table, bar chart.
| c |
Which form did you use to answer questions a
and b? |
| d |
Make a bar chart to show the data of Table 2.
(Your horizontal axis will be labelled 'instruments'.) |
Tables from Bar Charts
You will need page R1.

Figure 2 - Children's Hair Colour
Figure 2 shows the hair colours of a group of children. We can
work backwards to make a table from the bar chart.
Look at the bar chart.
| a |
How many children had brown hair? |
| b |
Write this number in the right-hand column of Table 6
on page Rl against the word 'Brown'. |
| c |
Complete the rest of the table for the other hair
colours. |
| d |
How many children were there altogether? |
| e |
How many children had hair colour beginning with
"B"? |
| f |
What fraction of all the children is this? |

Peas in a Pod
You will need page R1.
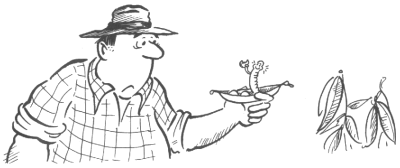
A market gardener wants to assess the quality of the pea seeds
he planted. He counts the number of peas in each of a sample of
pods. The results are shown in Figure 3.

Figure 3 - Number of peas in pod
| a |
Use the data from Figure 3 to complete Table 7 on
page Rl. |
| b |
How many pods were sampled? |
| c |
What was the most common number of peas in a pod? |
| d |
How many pods contained two peas? How many peas were
there in these pods? |
Two-way Tables
So far the tables have gone just one way. We read them going
down the page. Two-way tables are read both down and across the
page.
Each child in a class answered the question: 'Do you own a
bicycle?' The number of replies are shown in Table 3.
| |
Owned a bicycle |
Didn't own a bicycle |
Totals |
| Boys |
  |
8 |
|
  |
10 |
|
|
| Girls |
  |
6 |
|
 |
4 |
|
|
| Totals |
|
|
|
Table 3
| a |
How many boys owned a bicycle? |
| b |
How many girls didn't own a
bicycle? |
| c |
How manv bicycles were owned by
the class? |
| d |
How many girls were in the
class? |
| e |
How many children were in the
class? |
| f |
What fraction of the boys owned
bicycles? |
| g |
What fraction of the girls owned
bicycles? |
| h |
Who were better off for
bicycles, boys or girls? |
If your class includes both boys and girls, do i
and j.
If it has only boys or only girls, your teacher will tell you
what to do.
| i |
Make a table like Table 3 but
leave out the numbers. |
| j |
Complete the table, including
totals, with data from your class. |
Facts about Fires
You will need page R1.
Look at Table 8 on page R1. It is the same as Table 1.
| a |
How many fires were recorded
altogether? |
| b |
How many fires started in the
living room? |
| c |
How many fires were caused by
children? |
| d |
How many fires in the living
room were caused by television or radio? |
| e |
How many chimney fires started
in the roof space? |
| f |
Where did more fires start than
anywhere else? |
| g |
What caused more fires than
anything else? |
|